Last Update : 03/04/06
Debugging grammar file used to be frightening task. You either had to debug the super complex code generated by your parser generator tool or you had to enable some weird tracing mechanism and wade through loads and loads of text to find your mistake. And of course if you wanted to see ASTs or parse trees getting formed you usually had to write an entire program just to visualize it. So as you can guess, debugging grammar files was definitely not meant for the weak hearted.
But all that is about to change with ANTLR Studio’s Fluid Debugger. With the Fluid Debugger, debugging a grammar file is as simple and natural as debugging your java programs. Let’s take a look at debugging our sample grammar file which is a part of our java program. We assume that the parser/lexer is invoked somewhere in the program.
So just as we do with our java files, we place breakpoints on the relevant lines in the grammar file. You can place breakpoints on the definitions of rules or on actions. Once that is done we go ahead and debug our program. Note that you don’t have to do anything special. You just place your breakpoints and debug your program normally. When the execution reaches the point in the grammar where you have placed the breakpoint, it will break normally just as it does with your java files.
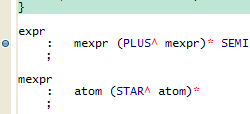
Put breakpoints on rules
Once it does break on a rule, you will notice a new button has been added to the debug view toolbar. It allows you to step horizontally! So you can step horizontally across rules. And if you want to step into one, just press the ‘Step Into’ button just as would for stepping inside a java method. Same goes for stepping out.
Step horizontally inside rules
What if you come across java code which is inside actions? Well, just step through it like normal java code, you can step into/out of functions, see the values of variables in the Variables view, etc. So as you can see the Fluid Debugger allows you to have a single debugging experience of your program, where you don’t have to think differently about your java code and the antlr grammar.
Step through java code inside actions
Now let’s take a look at the reeeally special part of Fluid Debugger, the two new views it adds. You can open these views by going to ‘Window->Show View->Other->Antlr Studio’.
The first one is called ‘Input Text’. If you turn on this view while you are debugging your grammar files, you can see the text that has been input to your parser. The color coding allows you to see how much text has been consumed, what is in the lookahead, what text is being being guessed, etc. For example, the text which has already been consumed by the parser is in black while the text which hasn’t been consumed is in light grey.
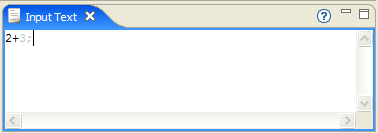
Watch your parser consuming the text given to it
The other view is the AST view. This allows you to view ASTs and parse trees as they are formed while you step through your grammar. When stepping through your parser grammar, if you have ‘buildAST=true’ in your options, you can view the AST for the current rule in this view. Note that the view wont show the entire AST but the AST for the current rule only, which is want to look at most of the times anyway.
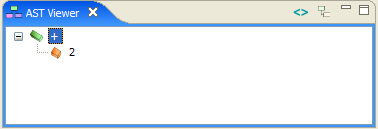
See ASTs getting formed
Not only that, if you click on the ‘angle bracket’ icon on top of the view, you can see a parse tree of all the rules that you have stepped through until now!
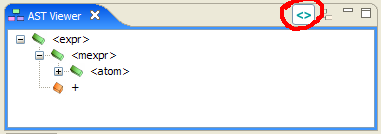
View Parse Trees
This view even works when you are debugging your treeparser. When debugging a tree parser, by default the view shows the AST which will be passed to the currently highlighted rule. On the other hand if you want to view any tree transformations taking place, click to toggle the ‘Show AST being passed’ button.
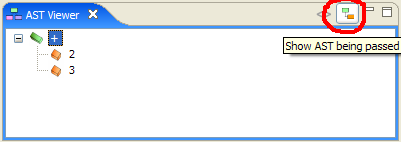
See the AST being passed while debugging your tree parser
Now although being able to debug grammar files is great, doing so adds a considerable amount of overhead in the generated code, which you obviously don’t want when doing a release build or profile of your code. So when doing either of these activites, you should tell ANTLR Studio to generate code in ‘release mode’, by disabling debugging.
To disable debugging –
As you can see, the Fluid Debugger takes out all the complexity of debuggging grammar files and provides you an experience similar to that of debugging java files. So that’s it for now. Happy debugging :)
Java and all Java-based trademarks and logos are trademarks or registered trademarks of Sun Microsystems, Inc. in the United States, other countries, or both.